
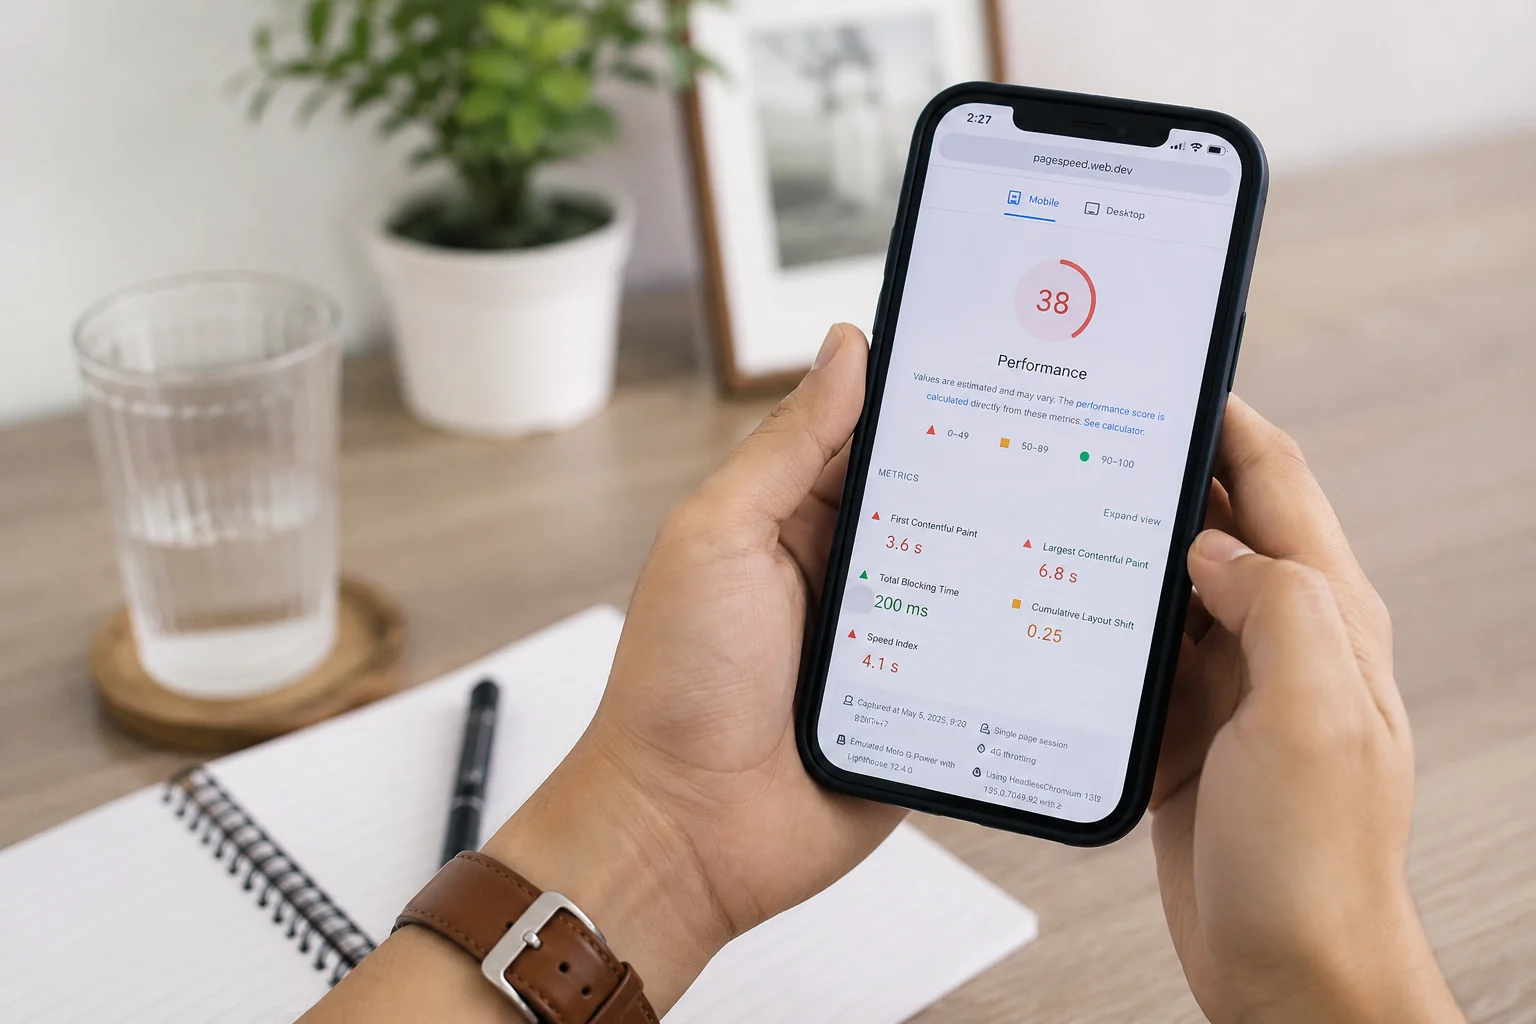
In the past 18 months, I have run Core Web Vitals audits on more than 40 websites across e-commerce, services, and SaaS. The most consistent finding is not that sites score poorly overall.
It is that they score well in a lab environment and poorly in real-user field data. Google uses field data, specifically the Chrome User Experience Report (CrUX), which aggregates performance data from real Chrome users over a 28-day rolling window, for its ranking signals, not the simulated Lighthouse score in PageSpeed Insights. That single distinction explains why many sites with 90-plus PageSpeed scores still rank below competitors whose sites appear slower in synthetic tests.
Core Web Vitals are three user experience metrics that Google treats as ranking signals: Largest Contentful Paint (LCP), Interaction to Next Paint (INP), and Cumulative Layout Shift (CLS). Each measures a different dimension of the user experience. Getting all three into the 'Good' range is the performance benchmark every website should be working toward in 2025, both for SEO and for the direct revenue impact that faster, more stable pages produce.
Lab Data vs Field Data: Why Your PageSpeed Score Can Lie
Lighthouse, the tool behind Google PageSpeed Insights, runs a simulated page load in controlled conditions: a specific network speed, a specific device profile, a single test. Field data from CrUX aggregates millions of real page loads across all device types and network conditions that actual users encounter. A site can score 95 in Lighthouse by optimizing for the test scenario and still score 'Poor' in field LCP because the majority of its real users are on mid-range Android devices on 4G networks in emerging markets.
The practical consequence is that you should always cross-reference your Lighthouse score with your CrUX field data, available directly in Google Search Console under Core Web Vitals. If your field data shows 'Needs Improvement' or 'Poor' while your Lighthouse score looks healthy, you have a real-world performance problem that your synthetic tests are not catching. This is the most common finding in our website audits.
LCP: Largest Contentful Paint
LCP measures how quickly the largest visible element on the page, usually a hero image, a heading, or a video thumbnail, loads for real users. Google's threshold for 'Good' is under 2.5 seconds. For e-commerce sites on mobile, where hero images dominate above-the-fold content, LCP is the single most impactful Core Web Vitals metric to optimize.
The most common causes of poor LCP are unoptimized hero images served without size optimization or a content delivery network (CDN), render-blocking fonts that delay text rendering, slow server response time (Time to First Byte above 600ms), and third-party scripts injected in the document head that block the critical rendering path. On every Next.js website we build, we address all four by default: hero images use the Next.js Image component with priority loading and WebP format, fonts are self-hosted with font-display: swap, server response time is optimized at the infrastructure level, and third-party scripts are deferred or loaded asynchronously.
Quick LCP Fixes With the Highest Impact
- Add fetchpriority='high' to your above-the-fold hero image and preload it in the document head
- Convert hero images to WebP or AVIF format, typically 25 to 50 percent smaller than JPEG at equivalent quality
- Serve images through a CDN so they load from a server geographically close to the user
- Eliminate or defer any JavaScript that executes before the LCP element renders
- Check your server TTFB in real field data. If it exceeds 600ms, server-side caching or infrastructure upgrade is needed
INP: Interaction to Next Paint
INP replaced First Input Delay (FID) as a Core Web Vital in March 2024. Where FID measured only the delay before the browser could respond to the first user interaction, INP measures the latency of all interactions throughout an entire page visit: every click, tap, and keyboard input.
A Good INP score is under 200 milliseconds. Sites that feel 'laggy' to users even after loading quickly usually have an INP problem.
The most common INP causes are heavy JavaScript execution on the main thread, third-party widgets (chat bots, popups, analytics with complex event handling), and React or other framework component trees that update too much in response to simple interactions. Unlike LCP, which is primarily a loading problem, INP is an execution problem. The fixes involve code splitting to reduce initial JavaScript payload, deferring non-critical scripts until after the first user interaction, breaking long tasks (tasks over 50ms) into smaller chunks using scheduler APIs, and auditing third-party scripts for main thread impact using the Chrome DevTools Performance panel.
CLS: Cumulative Layout Shift
Cumulative Layout Shift measures visual stability: how much the page content shifts around as it loads. A Good CLS score is under 0.1. A score above 0.25 is classified as Poor and is the most noticeable performance problem for users. It is what causes you to tap a button and accidentally click something else because the page shifted at the wrong moment.
The main causes of poor CLS are images without explicit width and height attributes (the browser cannot reserve space before the image loads), dynamically injected content like banners and cookie notices that push existing content down when they appear, and web fonts that render at a different size than the fallback font before they load. All three are straightforward to prevent during development but expensive to fix retroactively across a large site with hundreds of pages. This is why we enforce CLS prevention as a build standard on every project rather than treating it as a post-launch fix.
The Revenue Impact of Core Web Vitals
Google's own research consistently shows that sites meeting all three Core Web Vitals thresholds have significantly lower abandonment rates and higher conversion rates than sites that fail all three. The numbers vary by industry, but the causal relationship is consistent: faster, more stable pages convert better. For e-commerce, a 100ms improvement in load time can produce a 1 percent increase in conversion rate, according to Deloitte Digital research commissioned by Google.
A Shopify merchant we rebuilt on a custom Next.js storefront in late 2024 saw their field LCP drop from 4.2 seconds to 1.8 seconds and their CLS drop from 0.31 to 0.04 after the rebuild. In the 30 days following launch, their add-to-cart rate increased 14% and checkout completion rate increased 11% with no changes to marketing spend or product pricing.
The performance improvement alone drove the revenue change. This is the case we reference most often when clients ask whether website performance investment has measurable ROI.
Performance as an Ongoing Budget, Not a Launch Target
The most important mindset shift is treating website performance as an ongoing budget rather than a launch checklist. Third-party scripts accumulate over time as marketing teams add chat tools, heatmap trackers, A/B testing scripts, and tag manager triggers. Images get added to product pages and blog posts without optimization.
Developers add new features without auditing the JavaScript bundle size impact. Sites that launch with excellent Core Web Vitals scores can degrade to 'Needs Improvement' within six months without active performance monitoring.
We include quarterly Core Web Vitals reviews in our ongoing retainer engagements because scores can shift significantly with routine content and code changes. Google Search Console sends email alerts when field data drops below the Good threshold for a significant percentage of your pages. Setting up those alerts and responding to them promptly is the minimum viable performance monitoring approach. For the comprehensive approach, read about how we handle performance for client sites in our case studies, or contact us to discuss a performance audit for your site.
Need help with this?
Growthtrait can help you put this into practice. Let's talk about your goals.
Contact us