

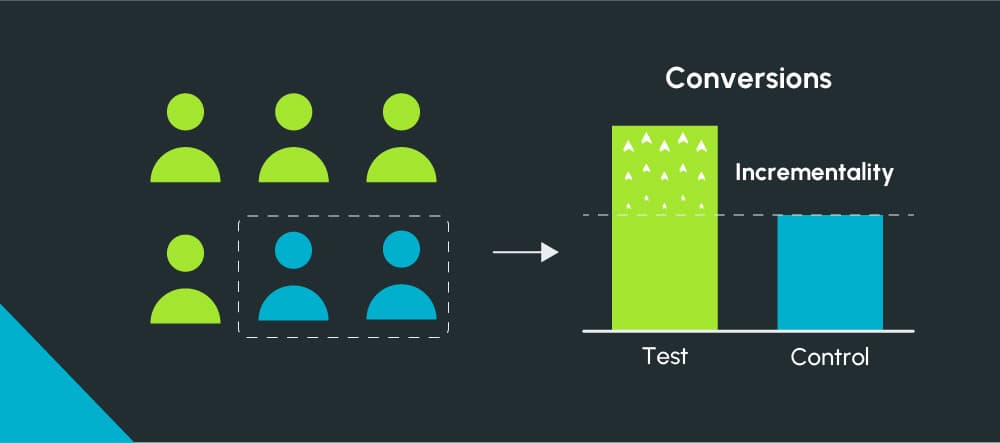
Add up the conversions your ad platforms report and you will often get more than the orders you actually had. Some of those buyers were going to purchase anyway: they knew your brand, searched for you by name, or came back from an email.
Incrementality testing measures the part of your results that the marketing actually caused. It is the closest thing marketing has to a controlled experiment, and it is the only reliable way to know whether a channel deserves more budget.
Most articles stop at the definition. This guide covers how to choose a test, how big it needs to be, how to design holdout and geo tests, the formulas for lift and incremental ROAS, how to tell a real result from noise, and how to turn the answer into a budget decision.
What Is Incrementality?
Incrementality is the extra outcome caused by a marketing activity compared with what would have happened without it. What would have happened anyway is the baseline. You measure it by comparing a test group that sees the marketing with a similar control group that does not.
Attribution answers a different question: which touchpoints get credit for conversions that happened. It cannot tell you whether those conversions needed the ad at all.
Where Incrementality Questions Matter Most
Channels that reach people who are already close to buying often show the strongest platform ROAS and the weakest incrementality: retargeting, branded search and campaigns aimed at existing customers. Prospecting to new audiences usually shows lower ROAS but more of it is incremental.
A real example: in our work with an Australian merchandise brand, Google Ads returned 10x ROAS in Q1 2024, with a 3.37 percent conversion rate on high-intent search. A result that strong is a reason to grow the channel, and also exactly the kind of number worth validating with a test before scaling far beyond its current level, because high-intent search captures demand that partly exists already.
Step 1: Choose the Right Test
- Platform conversion lift study: Meta and Google run a randomized holdout for you. Best when you are eligible and want a quick answer for one platform.
- Audience holdout: you exclude a random share of an audience, such as an email list or a customer retargeting list. Best for owned channels and retargeting.
- Geo experiment: you run or increase ads in some regions and not in comparable ones. Best when a channel cannot be randomized at the user level, or to test total spend levels. Meta's open source GeoLift helps design these.
- On and off test: you pause a channel and compare with a forecast. Cheapest, but weakest, because seasonality and promotions easily distort it.
Step 2: Calculate How Big the Test Must Be
Small tests produce noise that looks like results. For a test comparing conversion rates, a widely used rule of thumb for about 80 percent power at 5 percent significance is:
- Users needed per group ≈ 16 × p × (1 minus p) ÷ (difference to detect)².
- p is the baseline conversion rate, and the difference is the absolute lift you want to be able to detect.
- Example: with a 2 percent baseline and a goal of detecting a 10 percent relative lift (2.0 to 2.2 percent, a difference of 0.002), you need about 16 × 0.02 × 0.98 ÷ 0.000004, or roughly 78,000 users per group.
- To detect a 20 percent relative lift (2.0 to 2.4 percent), you need about a quarter of that, around 20,000 per group.
The lesson: the smaller the effect you expect, the larger the test. If your audience is too small to detect a realistic lift, use a longer test, a geo test or a platform study rather than trusting a small result.
Step 3: Design a Holdout Test
- Randomize at the user level, before exposure, so the groups are comparable.
- Choose the holdout share: 10 to 20 percent is common, a trade-off between test power and the revenue you give up in the control group.
- Fix the success metric in advance, ideally purchases or revenue, measured in your own store data.
- Run at least one full buying cycle, and avoid launching major promotions or new creative during the test.
- Check that the control group truly saw no ads from the tested campaign.
Step 4: Design a Geo Test
- Pick candidate regions with enough sales and stable history.
- Match test and control regions using pre-period data: their sales should move together closely before the test.
- Change only the tested channel's spend in test regions; keep everything else the same.
- Run long enough to cover the buying cycle plus a short period after, since ad effects can lag.
- Compare the test regions' actual sales with what the control regions predict they would have been.
Step 5: Calculate Lift and Incremental ROAS
- Lift = (test conversion rate minus control conversion rate) ÷ control conversion rate.
- Incremental conversions = (test rate minus control rate) × number of users in the test group.
- Incremental revenue = incremental conversions × average order value.
- iROAS = incremental revenue ÷ spend on the tested campaign.
- Incremental CPA = spend ÷ incremental conversions.
Illustrative example: 200,000 users in the test group convert at 2.4 percent and the control at 2.0 percent. Lift is 20 percent. Incremental conversions are 0.004 × 200,000 = 800. At a 60 dollar AOV, incremental revenue is 48,000 dollars. If the campaign cost 30,000 dollars, iROAS is 1.6 and incremental CPA is 37.50 dollars.
Step 6: Check the Result Is Real
A difference between groups is not automatically a real effect. Before acting:
- Look at the confidence interval of the lift, not just the point estimate. If it includes zero, the test did not prove an effect.
- Check that the groups looked similar before the test started.
- Make sure nothing else changed during the test, such as a sale, a stock out or a site outage.
- Prefer repeated tests over one dramatic result. Incrementality changes with season, creative and competition.
Step 7: Turn the Result Into a Budget Decision
Compare iROAS with your margin, not with revenue alone. A campaign is truly profitable when incremental revenue × CM2 ratio is larger than spend, so:
- Break-even iROAS = 1 ÷ CM2 ratio. With a 50 percent CM2 ratio, break-even iROAS is 2.
- In the example above, an iROAS of 1.6 is below 2, so the campaign loses money on the sales it actually caused, even if the platform reported a much higher ROAS.
- If iROAS is well above break-even, test higher spend in steps, because the next dollar is usually less efficient than the average.
Our contribution margin guide shows how to calculate the CM2 ratio this relies on.
Incrementality vs Marketing Mix Modeling
Marketing mix modeling (MMM) estimates each channel's impact from historical data, with open source options such as Meta's Robyn and Google's Meridian. MMM covers every channel at once but relies on modeling assumptions. Incrementality tests are narrower but causal. The strongest setup uses both: MMM for the overall budget split, and tests to calibrate the model on the channels that matter most.
Common Mistakes
- Stopping early because the first days look good.
- Running a test too small to detect a realistic lift, then reading noise as a result.
- Changing budget, creative or targeting mid-test.
- Judging success on platform conversions instead of your own sales data.
- Comparing iROAS with revenue targets instead of margin.
Where to Start
Pick the channel where you most suspect platform reports overstate results, often retargeting or branded search. Size the test with the formula above, run it for a full buying cycle, and decide in advance what result would change your budget.
If you want performance creative and content built to be tested and measured, our AI content marketing service can help. Contact us to plan your first test.
Frequently asked questions
What is incrementality testing?
Incrementality testing measures how many conversions a marketing activity caused that would not have happened without it, by comparing a group exposed to the marketing with a similar control group that was not.
How big does an incrementality test need to be?
A rule of thumb for about 80 percent power at 5 percent significance is 16 × p × (1 minus p) ÷ difference² users per group. With a 2 percent baseline, detecting a 10 percent relative lift needs roughly 78,000 users per group.
How do you calculate incremental ROAS?
Multiply the difference in conversion rate between test and control by the test group size to get incremental conversions, multiply by AOV to get incremental revenue, then divide by the campaign's spend.
What is a good iROAS?
It depends on your margin. Break-even iROAS is 1 divided by your contribution margin ratio before marketing. With a 50 percent margin, anything below 2 loses money on the sales the campaign actually caused.
What is the difference between incrementality and attribution?
Attribution assigns credit for conversions that happened. Incrementality uses a controlled comparison to measure whether those conversions were caused by the marketing at all.
Need help with this?
Growthtrait can help you put this into practice. Let's talk about your goals.
Contact us